What is an EBM?
This page is for a reader who knows machine learning but has not used an Explainable Boosting Machine. It defines the terms that the rest of the documentation uses.
Definitions
Explainable Boosting Machine (EBM). A model for tabular data from the InterpretML project (Nori et al., 2019). An EBM learns one function for each feature. To make a prediction, it adds the values of these functions and an intercept. A classifier then turns the sum into a probability. A regressor uses the sum as the predicted value.
Glass-box model. A model whose complete structure a person can read. The opposite is a black-box model, such as a large ensemble of boosted trees, which a person can only probe from the outside. An EBM is a glass-box model, because each of its parts is a graph that a person can look at.
Shape function (graph). The function that an EBM learns for one feature. It maps each value of the feature to a score, which is the contribution of that value to the prediction. EBaMl calls it the graph of the feature, because a person reads it as a graph: the feature on the horizontal axis and the score on the vertical axis. The rest of the documentation uses the word graph.
Local explanation. An explanation of one prediction for one input: why did the model predict this for this person? The opposite is a global explanation, which describes how the model works for all inputs.
How an EBM makes a prediction
An EBM is a generalized additive model. For an input with the features income, debt_ratio, age and
late_payments, a classifier computes this score:
score = intercept + graph_income(income) + graph_debt_ratio(debt_ratio) + graph_age(age) + graph_late_payments(late_payments)
The probability of the class is the logistic function of the score. Each term depends on one feature only. So the contribution of each feature to a prediction is one number, and the contributions add up to the score.
The graph below is the graph of income in an EBM of a synthetic loan data set. The line is the
score of each income. The band is the 95 % confidence interval of the score. A score above zero pushes toward
"granted", and a score below zero pushes toward "denied".
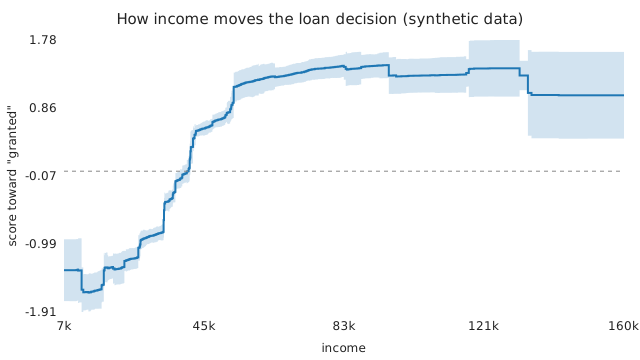
The docs build fits the EBM and draws this graph from it (scripts/docs/figures.py), so the graph always shows what
the code computes.
An EBM can also learn a term for a pair of features (an interaction). Such a term is a graph in two dimensions. The supported models table shows what EBaMl does with these terms.
Why a team uses an EBM
- Each prediction is readable. The contribution of each feature is one number that a person can check. For a black-box model, tools such as SHAP and LIME estimate the contributions instead.
- A person can find a wrong pattern. Caruana et al. (2015) fitted an additive model of the risk of death from pneumonia. The graph of asthma showed a lower risk for patients with asthma. The reason was that these patients got more intensive care, so the pattern was true in the data but wrong for a decision about care. A graph shows such a pattern, and a person can then remove it or edit it.
- A person can edit the model. Because each graph is a table of scores, a person can change the scores of some bins and know the exact effect on each prediction. Editing a model shows how.
- The accuracy is often close to a black-box model. The InterpretML paper says that an EBM "can be as accurate as
many blackbox models" (Nori et al., 2019). The documentation of
interpretsays that EBMs are designed to have an accuracy comparable to random forests and boosted trees. The gap depends on the data, so compare the models on your own data.
What an EBM costs
- The fit is slower. The documentation of
interpretsays that an EBM pays an additional training cost to keep the terms additive, so it is somewhat slower to fit than similar methods. A prediction is fast, because it is a lookup for each feature and a sum. - Interactions are limited. An EBM learns interactions of two features at most. If the data has strong interactions of three or more features, a black-box model can learn them and an EBM cannot.
- Readable is not the same as read. A model with 50 features has 50 graphs. A person must still read them, and the graph of each feature has many bins. EBaMl helps here: see Why EBaMl?.
References
- Nori, H., Jenkins, S., Koch, P. and Caruana, R. (2019). InterpretML: A Unified Framework for Machine Learning Interpretability. arXiv:1909.09223.
- The documentation of
interpret: Explainable Boosting Machine. - Lou, Y., Caruana, R., Gehrke, J. and Hooker, G. (2013). Accurate Intelligible Models with Pairwise Interactions. KDD 2013.
- Caruana, R., Lou, Y., Gehrke, J., Koch, P., Sturm, M. and Elhadad, N. (2015). Intelligible Models for HealthCare: Predicting Pneumonia Risk and Hospital 30-day Readmission. KDD 2015.